Flood zones & insurance in St. Pete
Zone by zone, carrier by carrier — what coverage really costs on a bay-front peninsula after the 2024 storms.
Read onThe neighborhoods · Chapter 08
The city's southern tip — mid-century streets on a peninsula in Tampa Bay, the pink pavement nobody else has, and a waterfront read that starts with the flood map.
live data connecting
This band shows real market numbers — median sale price, days on market, active inventory — computed over Everlane’s own copy of the Stellar MLS data, with the computation time shown. Live numbers publish here as soon as the data feed is connected; until then we show you nothing rather than a made-up number.
Based on information from Stellar MLS® for the period shown with each statistic — median sale price and days on market: trailing 90 days; active listings: as of the computation time shown; price per square foot: trailing 12 months.
Built by Selenko, Everlane’s own studio automation — see how this site runs →
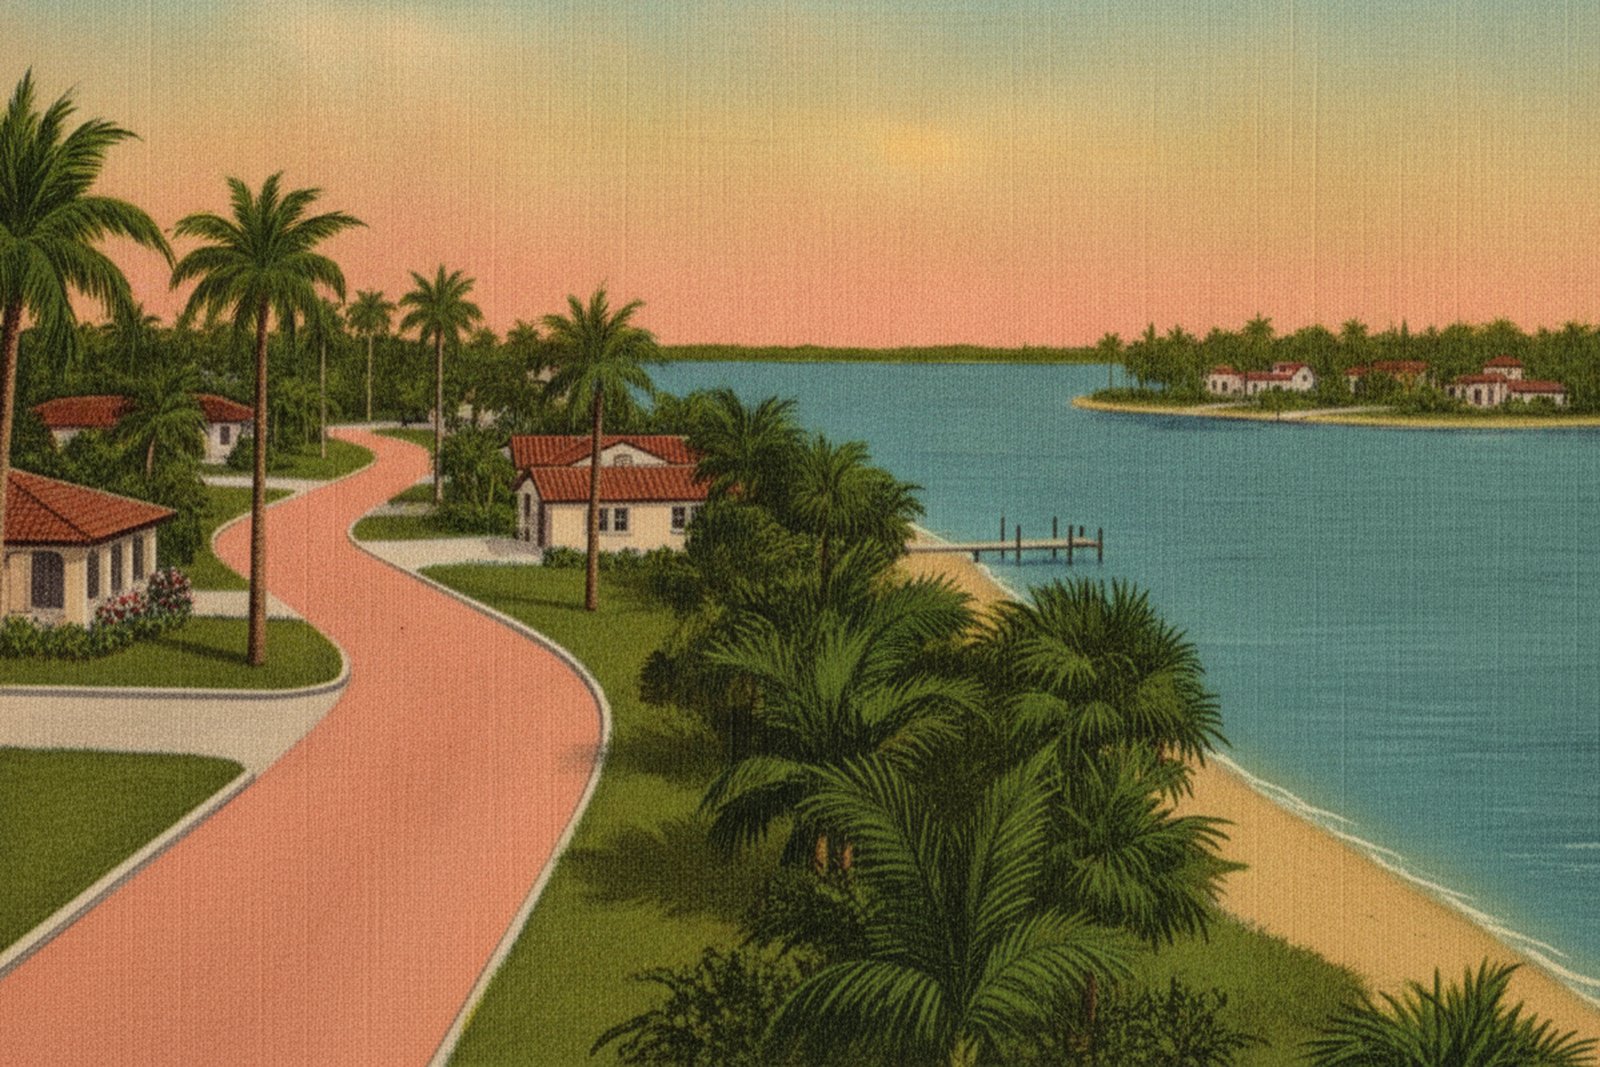
Pinellas Point is where St. Petersburg runs out of land — a peninsula at the city’s southern tip that pushes into Tampa Bay, ringed by waterfront parks and aimed at the Sunshine Skyway on the horizon. Pinellas Point Park sits right on the bay as one of the city’s waterfront parks (City of St. Petersburg Parks & Recreation, accessed July 2026). It’s a mid-century neighborhood, not a pre-war one: the streets filled in after World War II with one-story ranches and concrete-block houses — an assortment of mid-century, revival, and custom work rather than a single protected historic period (The Gabber, “The Pink Streets of St. Petersburg,” accessed July 2026). And the signature is literally underfoot — pink pavement, laid here in 1925, that exists nowhere else in the county.
What the listings won’t put into words is the pace. This is the quiet, low-key end of the city: water on the point’s edges, parks instead of nightlife, downtown’s blocks a real drive north rather than a walk. My read as a broker — and I’ll flag it as a judgment, not a number — is that for comparable closeness to the water, the Point has historically traded below the northeast waterfront. The value has always been down here, if you’re willing to be south of everything. The price bands on this page compute from the feed; I’d rather show you real ranges than a figure I typed.
The daily texture is water and greenspace. The bay is the neighborhood’s front edge, Pinellas Point Park is one of the city’s waterfront parks on it (City of St. Petersburg Parks & Recreation, accessed July 2026), and the housing is the mid-century Florida vocabulary — low ranches and block construction, on lots that run more generous than the tight pre-war grids closer to downtown. (That last comparison is my own read across the blocks, not a surveyed figure — MEDIUM.)
The trade for the calm is the geography: a point in the bay is a point in the flood conversation. Waterfront and low-lying southern blocks carry the coastal ratings; higher interior ground reads more moderately — and the only honest way to know which one you’re standing on is the county flood map, per address. The flood box below is how we read that before anyone falls in love.
Two things here are genuinely one of one.
The Pink Streets are the famous one: roughly four and a half miles of pink-red pavement south of Pinellas Point Drive, between 10th and 22nd Streets South (The Gabber, accessed July 2026). They date to the spring of 1925, when Marguerite Cook and her son George laid pink-tinted concrete through their Murok Realty development because no one else had it — a July 1925 St. Petersburg Times account described “a dull red, a color obtained by a mixture of one part cement, two parts sand and four parts selected gravel” (quoted in The Gabber, accessed July 2026). The color eventually faded and the roads decayed, until a five-year resident campaign got the City Council to protect them in 1989 and nearly four and a half miles were restored in the early 1990s (The Gabber, accessed July 2026). You buy on a named color out here, and the neighborhood once fought the city to keep it.
The quieter landmark is older by a thousand years. Indian Mound Park preserves a Tocobaga temple mound on the point — a prehistoric earthwork you can walk, with its history posted on site (City of St. Petersburg Parks & Recreation — Indian Mound Park; Pinellas Point Mound — both accessed July 2026). The mound was donated to the city in 1958 and carries a marker erected in 1960 by the Princess Hirrihigua Chapter of the Daughters of the American Revolution (Pinellas Point Mound, accessed July 2026). Most St. Pete neighborhoods sell you a decade of provenance; this one has a horizon that runs back to before the city existed.
The same honesty as every chapter: the numbers render from data, not from a guide that goes stale. The stat band on this page computes from our MLS pipeline — median sale price, days on market, active inventory — and refreshes continuously; if it shows nothing yet, the pipeline hasn’t connected, and we would rather show you nothing than a made-up figure. What I’ll say in words is the shape from up top — the Point has historically been the value end of the waterfront map for the water you actually get — and that the range out here is wide: a block-built ranch on an interior street and a grand estate on the open bay are the same neighborhood on paper. Which one your budget and your flood tolerance point toward is the deal-level conversation, and that one is free.
These bands compute from closed sales in the Stellar MLS feed (trailing 12 months) the moment the data feed connects — honest ranges, never AVM point estimates, never made-up numbers. Until then this box stays empty on purpose: we render real data or nothing.
Pinellas Point is a peninsula pushing into Tampa Bay at the city's southern tip, so the flood posture is a per-address question, not a neighborhood one: blocks along the open bay and the low-lying southern edge carry the high-risk coastal ratings where coverage is required and priced to the elevation certificate, while higher interior ground reads more moderately. St. Petersburg took real storm surge in the 2024 hurricane season, which makes the per-address read non-negotiable here — the county publishes both the flood layer and existing elevation certificates free, and we confirm both per listing, never assumed.
Flood data source: FEMA flood maps via the Pinellas County Flood Map Service (not MLS data) · verified July 8, 2026
Read the flood & insurance guide →Live Pinellas Point inventory renders here — straight from our copy of the Stellar MLS feed with full attribution, the moment the data feed connects. Until then: open the live search →
Zone by zone, carrier by carrier — what coverage really costs on a bay-front peninsula after the 2024 storms.
Read onWhere Pinellas Point sits in the city's larger map — organized by what each place is actually good at.
Read onThe northeast waterfront the Point is measured against — the historic grid at the other end of the city.
Read onTalk to the broker who wrote the chapter. Fifteen minutes, free, and the messy version of your situation is the right version to bring.
A free 30-minute consult, straight onto Serge’s calendar. Prefer to write first? use the contact page →